
siibra.features.tabular.regional_timeseries_activity
Classes
Blood-oxygen-level-dependent (BOLD) signals per region. |
|
Datasets that provide regional activity over time. |
Module Contents
- class siibra.features.tabular.regional_timeseries_activity.RegionalBOLD(paradigm: str, **kwargs)
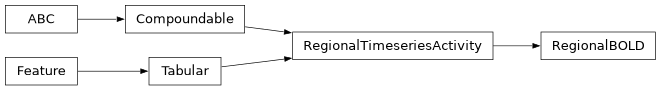
Blood-oxygen-level-dependent (BOLD) signals per region.
- property name
Returns a short human-readable name of this feature.
- paradigm
- class siibra.features.tabular.regional_timeseries_activity.RegionalTimeseriesActivity(cohort: str, modality: str, regions: list, connector: siibra.retrieval.repositories.RepositoryConnector, decode_func: Callable, filename: str, anchor: siibra.features.anchor.AnatomicalAnchor, timestep: str, description: str = '', datasets: list = [], subject: str = 'average', id: str = None, prerelease: bool = False)
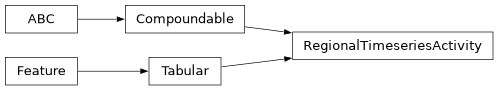
Datasets that provide regional activity over time.
- __str__()
- compute_centroids(space)
Computes the list of centroid coordinates corresponding to dataframe columns, in the given reference space.
- plot(regions: List[str | siibra.core.region.Region] = None, *args, backend='matplotlib', **kwargs)
Create a bar plot of averaged timeseries data per region.
- plot_carpet(regions: List[str | siibra.core.region.Region] = None, *args, backend='plotly', **kwargs)
Create a carpet plot of the timeseries data per region.
- cohort
- property data: pandas.DataFrame
Returns a table as a pandas dataframe where the index is a timeseries.
- property name
Returns a short human-readable name of this feature.
- regions
- property subject
Returns the subject identifiers for which the table represents.
- timestep