
siibra.features.tabular
Multimodal data features in tabular formats.
Submodules
- siibra.features.tabular.bigbrain_intensity_profile
- siibra.features.tabular.cell_density_profile
- siibra.features.tabular.cortical_profile
- siibra.features.tabular.gene_expression
- siibra.features.tabular.layerwise_bigbrain_intensities
- siibra.features.tabular.layerwise_cell_density
- siibra.features.tabular.local_field_potential
- siibra.features.tabular.receptor_density_fingerprint
- siibra.features.tabular.receptor_density_profile
- siibra.features.tabular.regional_timeseries_activity
- siibra.features.tabular.tabular
Classes
Represents a 1-dimensional profile of measurements along cortical depth, |
|
Represents a 1-dimensional profile of measurements along cortical depth, |
|
A set gene expressions for different candidate genes |
|
Represents a table of different measures anchored to a brain location. |
|
Local field potential recording anchored to Waxholm coordinates and potentially a region. |
|
Represents a table of different measures anchored to a brain location. |
|
Represents a 1-dimensional profile of measurements along cortical depth, |
|
Blood-oxygen-level-dependent (BOLD) signals per region. |
|
Local field potential recording anchored to Waxholm region and a preselected spectrum type. |
Functions
|
|
|
Package Contents
- class siibra.features.tabular.BigBrainIntensityProfile(anchor: siibra.features.anchor.AnatomicalAnchor, depths: list, values: list, boundaries: list)
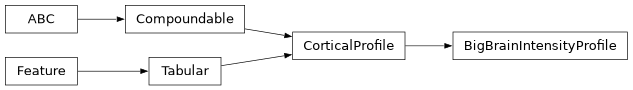
Represents a 1-dimensional profile of measurements along cortical depth, measured at relative depths between 0 representing the pial surface, and 1 corresponding to the gray/white matter boundary.
Mandatory attributes are the list of depth coordinates and the list of corresponding measurement values, which have to be of equal length, as well as a unit and description of the measurements.
Optionally, the depth coordinates of layer boundaries can be specified.
Most attributes are modelled as properties, so dervide classes are able to implement lazy loading instead of direct initialization.
- DESCRIPTION = "Cortical profiles of BigBrain staining intensities computed by Konrad Wagstyl, as described in...
- property location
- class siibra.features.tabular.CellDensityProfile(section: int, patch: int, url: str, anchor: siibra.features.anchor.AnatomicalAnchor, datasets: list = [], id: str = None, prerelease: bool = False)
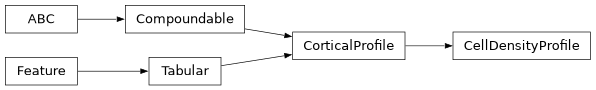
Represents a 1-dimensional profile of measurements along cortical depth, measured at relative depths between 0 representing the pial surface, and 1 corresponding to the gray/white matter boundary.
Mandatory attributes are the list of depth coordinates and the list of corresponding measurement values, which have to be of equal length, as well as a unit and description of the measurements.
Optionally, the depth coordinates of layer boundaries can be specified.
Most attributes are modelled as properties, so dervide classes are able to implement lazy loading instead of direct initialization.
- boundary_annotation(boundary: Tuple[int, int]) numpy.ndarray
Returns the annotation of a specific layer boundary.
- layer_annotation(layer: int) numpy.ndarray
- BIGBRAIN_VOLUMETRIC_SHRINKAGE_FACTOR = 1.931
- DESCRIPTION = 'Cortical profile of estimated densities of detected cell bodies (in detected cells per 0.1 cube...
- property boundary_positions
- property cells: pandas.DataFrame
- property density_image: numpy.ndarray
- property depth_image: numpy.ndarray
Cortical depth image from layer boundary polygons by equidistant sampling.
- property layer_mask: numpy.ndarray
Generates a layer mask from boundary annotations.
- property layers: pandas.DataFrame
- property location
- patch
- section
- property shape
(y,x)
- class siibra.features.tabular.GeneExpressions(levels: List[float], z_scores: List[float], genes: List[str], additional_columns: dict, anchor: siibra.features.anchor.AnatomicalAnchor, datasets: List = [DATASET])

A set gene expressions for different candidate genes measured inside a brain structure.
- plot(*args, backend='matplotlib', **kwargs)
Create a box plot per gene.
- Parameters:
backend (str) – “matplotlib”, “plotly”, or others supported by pandas DataFrame plotting backend.
**kwargs – Keyword arguments are passed on to the plot command.
- ALLEN_ATLAS_NOTIFICATION = Multiline-String
Show Value
"""
    For retrieving microarray data, siibra connects to the web API of
    the Allen Brain Atlas (© 2015 Allen Institute for Brain Science),
    available from https://brain-map.org/api/index.html. Any use of the
    microarray data needs to be in accordance with their terms of use,
    as specified at https://alleninstitute.org/legal/terms-use/.
    """
- DATASET
- DESCRIPTION = Multiline-String
Show Value
"""
    Gene expressions extracted from microarray data in the Allen Atlas.
    """
- unit = 'expression level'
- class siibra.features.tabular.LayerwiseBigBrainIntensities(anchor: siibra.features.anchor.AnatomicalAnchor, means: list, stds: list)

Represents a table of different measures anchored to a brain location.
Columns represent different types of values, while rows represent different samples. The number of columns might thus be interpreted as the feature dimension.
As an example, receptor fingerprints use rows to represent different neurotransmitter receptors, and separate columns for the mean and standard deviations measure across multiple tissue samples.
- DESCRIPTION = "Layerwise averages and standard deviations of of BigBrain staining intensities computed by...
- class siibra.features.tabular.LocalFieldPotential(anchor: siibra.features.anchor.AnatomicalAnchor, db_entry: Dict)

Local field potential recording anchored to Waxholm coordinates and potentially a region.
- get_lfp_file()
Fetch the local field potential data file.
- Returns:
Open file handle returned by the HTTP request.
- Return type:
h5-file-like
- Raises:
MissingFileException – If no local field potential file is available for this entry.
- get_motion_file()
Fetch the motion data file.
- Returns:
Open file handle returned by the HTTP request.
- Return type:
h5-file-like
- Raises:
MissingFileException – If no motion file is available for this entry.
- get_psd_file()
Fetch the power spectral density file.
- Returns:
Open file handle returned by the HTTP request.
- Return type:
h5-file-like
- Raises:
MissingFileException – If no power spectral density file is available for this entry.
- classmethod get_spectra(lfps: List[LocalFieldPotential])
Compute an average spectrum from local field potential features.
- Parameters:
lfps (list of LocalFieldPotential) – Local field potential features to include in the spectrum.
- Returns:
Average spectrum indexed by frequency.
- Return type:
- classmethod plot_spectra(lfps: List[LocalFieldPotential], backend='matplotlib', **kwargs)
Plot an average spectrum from local field potential features.
- Parameters:
lfps (list of LocalFieldPotential) – Local field potential features to include in the spectrum.
backend (str, optional) – Plotting backend passed to
pandas.DataFrame.plot(). The default is"matplotlib".**kwargs – Additional keyword arguments passed to
pandas.DataFrame.plot().
- Returns:
Plot object returned by the selected pandas plotting backend.
- Return type:
- ID_TEMPLATE = '41673110-f3eb-43cd-9d9c-c845c6f0573c--{index}'
- property coordinates
- property name
Returns a short human-readable name of this feature.
- property pathology
- property pharmacology
- property session
- property signal_quality
- property subject
- class siibra.features.tabular.ReceptorDensityFingerprint(tsvfile: str, anchor: siibra.features.anchor.AnatomicalAnchor, datasets: list = [], id: str = None, prerelease: bool = False)

Represents a table of different measures anchored to a brain location.
Columns represent different types of values, while rows represent different samples. The number of columns might thus be interpreted as the feature dimension.
As an example, receptor fingerprints use rows to represent different neurotransmitter receptors, and separate columns for the mean and standard deviations measure across multiple tissue samples.
- classmethod parse_tsv_data(data: dict)
- plot(*args, receptors: List[str] = None, backend: str = 'matplotlib', **kwargs)
Create a bar plot of receptor density fingerprint.
- polar_plot(*args, backend='matplotlib', **kwargs)
Create a polar plot of the fingerprint. backend: str
“matplotlib” or “plotly”
- DESCRIPTION = 'Fingerprint of densities (in fmol/mg protein) of receptors for classical neurotransmitters...
- property data
- property neurotransmitters: List[str]
- property receptors: List[str]
- property unit: str
- class siibra.features.tabular.ReceptorDensityProfile(receptor: str, tsvfile: str, anchor: siibra.features.anchor.AnatomicalAnchor, datasets: list = [], id: str = None, prerelease: bool = False)
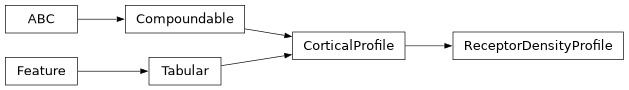
Represents a 1-dimensional profile of measurements along cortical depth, measured at relative depths between 0 representing the pial surface, and 1 corresponding to the gray/white matter boundary.
Mandatory attributes are the list of depth coordinates and the list of corresponding measurement values, which have to be of equal length, as well as a unit and description of the measurements.
Optionally, the depth coordinates of layer boundaries can be specified.
Most attributes are modelled as properties, so dervide classes are able to implement lazy loading instead of direct initialization.
- classmethod parse_tsv_data(data)
- DESCRIPTION = 'Cortical profile of densities (in fmol/mg protein) of receptors for classical neurotransmitters...
- property key
- property neurotransmitter
- receptor
- property receptor_fullname
- property unit
Optionally overridden in derived classes.
- class siibra.features.tabular.RegionalBOLD(paradigm: str, **kwargs)
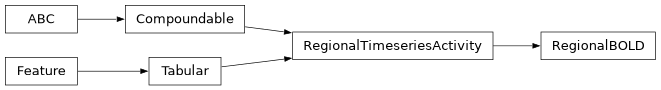
Blood-oxygen-level-dependent (BOLD) signals per region.
- property name
Returns a short human-readable name of this feature.
- paradigm
- class siibra.features.tabular.RegionalLocalFieldPotential(anchor: siibra.features.anchor.AnatomicalAnchor, db_entries: pandas.DataFrame, pathology: str | None = None, pharmacology: str | None = None, signal_quality: str | None = None)

Local field potential recording anchored to Waxholm region and a preselected spectrum type.
- plot(*args, backend='matplotlib', **kwargs)
Plot the average local field potential spectrum.
- Parameters:
*args – Positional arguments passed to the parent plotting method.
backend (str, optional) – Plotting backend passed to the parent plotting method. The default is
"matplotlib".**kwargs – Additional keyword arguments passed to the parent plotting method.
- Returns:
Plot object returned by the selected backend.
- Return type:
- ID_TEMPLATE = '41673110-f3eb-43cd-9d9c-c845c6f0573c--{indices_as_hex}'
- property coordinates
- property data
Compute the smoothed median spectra represented by this feature.
- Returns:
Average spectra by type and indexed by frequency.
- Return type:
Notes
Accessing this property downloads the required power spectral density files and recomputes the spectrum.
- property name
Returns a short human-readable name of this feature.
- pathology = None
- pharmacology = None
- property session
- signal_quality = None
- property subjects
- siibra.features.tabular.cell_reader(bytes_buffer: bytes)
- siibra.features.tabular.layer_reader(bytes_buffer: bytes)